Chapter 1 : Sources of Reservoir Fish Habitat Problems


1.1 Introduction
1.2 A Nationwide Habitat Degradation Survey
1.3 Geographical Patterns in Habitat Degradation
1.4 Reservoir Aging
1.5 Downstream Concerns

1.1 Introduction

Reservoirs have distinct habitat characteristics and degradation patterns due to their terrestrial origin and strong linkage to watersheds. Unlike natural lakes, reservoirs tend to have large watersheds and large tributaries because they were engineered to capture as much water as possible to serve flood control, water supply, navigation, or other purposes. This origin is manifested by relatively large inputs of inorganic and organic loads, nutrients, and contaminants. Depositional filling effectively results in surface area and volume reductions, habitat fragmentation, loss of depth, and associated changes in water quality. Unnatural water-level fluctuations interact with wave action to degrade shorelines that were once uplands and are unable to withstand continuous flooding, which promotes erosion and ultimately homogenization of once diverse littoral habitats. Well-established riparian zones and floodplain wetlands that provide key ecological services to natural lakes and the original river are mostly missing in reservoirs. Lack of woody debris deposition in the littoral zone, limited access to adjacent backwaters, and lack of seed banks and stable water levels to promote native aquatic vegetation characterize barren littoral habitats in many reservoirs, although in some cases there is excessive growth of nonnative aquatic vegetation. Because of their artificial origin reservoirs reveal unique fish habitat problems, exhibit senescing patterns not well correlated with chronological age, and can have major effects on habitats downstream from the dam.

Back to top

1.2 A Nationwide Habitat Degradation Survey

Krogman and Miranda (20161) used an online survey to canvass resource man- agers about habitat degradation in reservoirs across the continental USA. The survey included about 75 questions regarding fish habitat in the reservoir and tailrace below the dam, recorded on a six-point degradation scale from 0 to 5: 0 = none, 1 = low, 2 = low to moderate, 3 = moderate, 4 = moderate to high, and 5 = high. The questions in- quired about degradation to water quality and clarity, water fluctuations and flow through, submerged structure and vegetation, littoral and riparian zones, watershed uses, other habitat features of the reservoirs, and issues afflicting fish habitat in the tailrace. The survey also included questions about fish assemblages, fish populations, and fisheries. The fish data were collected on a five-point scale ranging from 1 to 5:  1 = low, 2 = below average, 3 = average, 4 = above average, and 5 = high. Respondents were fisheries biologists charged with managing fish in a specific reservoir, and the responses represented nearly 1,300 reservoirs 250 ac or more, approximately a 25% sample of U.S. reservoirs in that size class.

Back to top

1.3 Geographical Patterns in Habitat Degradation

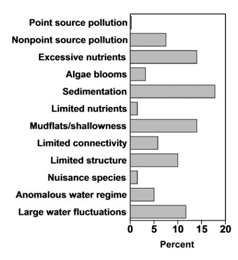
Factor analysis applied to responses to the nationwide habitat degradation survey conducted by Krogman and Miranda (2016) identified 12 major factors descriptive of habitat degradation (Table 1.1). The factors represented various degradations originating from within the reservoir or its watershed. Nationwide, degradation factors such as sedimentation, excessive nutrients, excessive mudflats and shallowness, water-level fluctuations, and limited submerged structure affected 10%–20% of reservoirs (Figure 1.1).

Table 1.1. Major reservoir habitat degradation factors in a sample of U.S. reservoirs ≥ 250 ac as estimated by Krogman and Miranda (2016). Each factor represents several observed variables scored by local fish biologists during an online survey.
Factor Description
Point source pollution Reservoirs with point source environmental problems stemming from watershed activities, thermal inputs, and contaminants
Nonpoint source pollution Reservoirs with nonpoint source environmental problems stemming from broadly distributed watershed activities
Excessive nutrients Reservoirs with excessive nutrient inputs originating from a broad area of the watershed
Algal blooms Reservoirs with water-quality problems associated with variable oxygen, high temperature, and algal blooms
Sedimentation Reservoirs with high suspended and deposited sediments and associated loss of habitat
Limited nutrients Reservoirs that are often deep and oligotrophic or may be undergoing undesired oligotrophication
Mudflats and shallowness Reservoirs that are excessively shallow particularly in the littoral zone and have extensive mudflats
Limited connectivity to adjacent habitats Reservoirs with a lack or loss of connectivity to adjacent habitats, including backwaters and tributaries
Limited littoral structure Reservoirs with insufficient physical structure and homogenized littoral habitats
Nuisance species Reservoirs with aggressively expanding, typically non-native plant or animal species
Anomalous water regime Reservoirs with frequent or poorly timed fluctuations or flushing
Large water fluctuations Reservoirs with large or long-duration (or both) water-level fluctuations


Figure 1.1. Percent of 1,299 U.S. reservoirs ≥ 250 ac scoring high (i.e., moderate-to-high degradation, and high degradation) in the survey for each of 12 habitat degradation factors defined in Table 1.1.

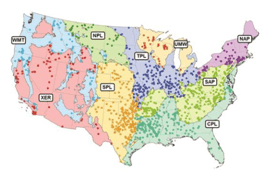
Intensity of degradation differed geographically among ecoregions, and ecoregions often were defined by a unique degradation or set of degradations (Figure 1.2). For example, degradation due to large water-level fluctuation was most common in the drier areas of the contiguous USA, including the West (ecoregions WMT and XER; Figure 1.3) and large sections of the Great Plains (NPL and SPL). Water is scarcer in these areas and typically is collected for irrigation; water levels may fluctuate widely as incoming water is stored during the rainy season and released throughout the growing season. The water storage and allocation required to optimize water availability for irrigation often can conflict with the needs of fish by altering environmental cues or seasonal habitat availability (Ploskey 19862; Bunn and Arthington 20023; Dagel and Miranda 20124). Large water-level  fluctuation  was  also the most important degradation in the Northeast (NAP); however, the extent of this degradation was relatively lower than in other regions.

Figure 1.2. Percent of U.S. reservoirs ≥ 250 ac scoring high (i.e., moderate-to-high degradation, and high degradation) for each of 12 habitat degradation factors (Table 1.1) in the nine ecoregions identified in Figure 1.3.

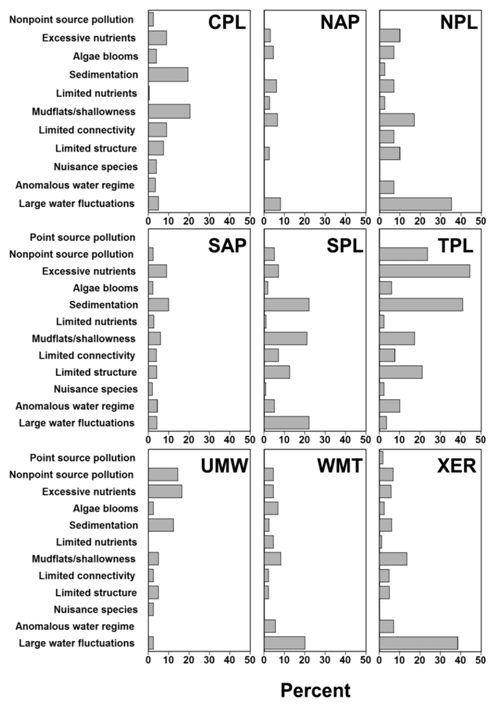
Unlike the West, most habitat degradation in the Midwest (TPL and UMW) and South (CPL) emphasized factors reflective of incoming water quality and land management in the reservoir’s watershed rather than water storage. A reservoir’s watershed is often the primary source of inputs into the reservoir, including nutrients, sediment, chemicals, and other pollutants (Kimmel and Groeger 19865; Kennedy and Walker 19906; Thornton 19907). Excessive nutrient input was the most important degradation in the Midwest, followed by sedimentation and nonpoint source pollution. Runoff from agricultural land contributes to all of these degradations; farm land covers more than 72% of Iowa (ISU 20138) and 60% of Illinois (IDNR 20139). In the South, sedimentation and mudflats and shallowness were the most important degradations, whereas excessive nutrient input was less important.

Figure 1.3. Ecoregions of the conterminous USA identifying position of reservoirs (points) of 1,299 reservoirs ≥ 250 ac included in the survey. Regions include Xeric (XER), Western Mountains (WMT), Northern Plains (NPL), Temperate Plains (TPL), Southern Plains (SPL), Upper Midwest (UMW), Coastal Plains (CPL), Southern Appalachian (SAP), and Northern Appalachian (NAP).

Interestingly, this lowered importance of nutrients coincides with less land coverage by traditional agricultural land and greater land coverage by timber land. In the southeastern states of Florida, Georgia, North Carolina, South Carolina, and Virginia, about 60% of the land is forested, and over 95% of the forested land is considered timber land (Smith et al. 200910). This region includes about 12% agricultural land (USDA 200911). In the south central states of Alabama, Arkansas, Kentucky, Louisiana, Mississippi, Oklahoma, Tennessee, and Texas, about one-third of the land is forested, with over 90% considered timber land; this region also  has  about  20% agricultural  land (USDA 2009).

Commercial forestry practices such as roadbuilding and clear-cutting during harvest could export additional sediment and, to a lesser degree, nutrients to waterways directly (Ensign and Mallin 200112) or indirectly by altering streamflow (Troendle and Olsen 199413). Thus, reservoirs in the Midwest and South show faster rates of sedimentation and eutrophication than in other regions and hence faster functional aging as defined in section 1.4. The close ties among land use, eutrophication, and functional age were demonstrated effectively for Kansas reservoirs by Carney (200914).

Back to top

1.4 Reservoir Aging

The twentieth century was the golden age for construction of large reservoirs in the USA. Although some reservoirs were constructed in the nineteenth century, the rate of construction accelerated dramatically in the early 1900s, peaked near midcentury, and decreased to pre-1900s levels by the opening of the twenty-first century (Figure 1.4). Over the twentieth century unevenness in construction rates is apparent and linked to major events. For example, construction declined in 1915–1920 coinciding with World War I and then again in the early 1930s coinciding with the Great Depression. Construction accelerated to its fastest pace in the second half of the 1930s coinciding with the work programs developed to counteract the economic depression but declined again in the 1940s coinciding with World War II. Pace of construction picked up again in the 1950s to reach another peak in the late 1960s. Beginning in the early 1970s a steady decline in construction becomes apparent. The acceleration at the be- ginning of the twentieth century may be attributed to various engineering achievements (e.g., electrification, internal combustion engine, concrete design). The deceleration at the end of the century may be attributed to rising costs, depletion of suitable construction sites, and the strengthening of environmentalist views.

Figure 1.4. Distribution (percent by year) of reservoir construction in the USA, 1815–2010. N represents the sample size of reservoirs ≥ 250 ac. Selected historic events are identified within the plot (WW = World War).

This roughly symmetric construction distribution has produced a counterpart distribution of ages. Examination of the age distribution reveals that as of 2016 the median age of U.S. reservoirs was 66 years, with 15th and 85th percentiles at 38 and 102 years, respectively. Similarly, the mean age was 71 years with ±1 standard deviation at 40 and 102 years. Projecting these distributions into the future, and assuming no or few new reservoirs will be constructed, by the year 2050 the median age of U.S. reservoirs is expected to be about 100 years and the mean 105 years.

Gerontologists long have recognized that definitions of human age that focus exclusively on chronological age (years since birth) are incomplete because they are independent of human physiological and psychological factors (Baars and Visser 200715). Similarly, the rate at which reservoirs age may not be described best by chronological age. The rate of aging may depend on a diversity of attributes driven by climate and geography, watershed magnitude and composition, and reservoir hydrology and morphology. The crux of the problem with chronological age is that there are marked differences among humans and among reservoirs in the rate at which entities change over time. The implication of these differences is that chronological age and functional age (position along life span) may be related only weakly, and for many applications functional age may be more relevant than chronological age.

Reservoirs vary in their geographical distribution, physical characteristics, and operational scheme, potentially creating large variability in functional age. Reservoirs tend to have large watersheds and tributaries because they were engineered to capture as much water as possible to serve flood control, water supply, hydropower, or other purposes (Kennedy 199916). This unique hydrology can produce large input and retention of sediment and nutrients, although quantity may vary depending on climate, geology, and land cover. Thus, effects of inputs may differ depending on reservoir morphology. Depositional filling reduces depth and surface area and has been estimated to cause backwater isolation and habitat fragmentation (Patton and Lyday 200817). Wave action, coupled with unnatural water-level fluctuations dictated by operational goals, alter shorelines that were once uplands and are maladapted to continuous or seasonal flooding. Over time this promotes erosion and homogenization of once diverse littoral habitats (Allen and Tingle 199318). Well-established riparian zones and wetlands that provide key ecological services to natural lakes and the original river generally are limited to upper reaches near the entrance of tributaries but often degrade because of unnatural water-level fluctuations (Miranda et al. 201419). Lack of woody debris deposition in the littoral zone, limited access to backwaters and wetlands, and lack of seed banks and stable water levels to promote native aquatic plants characterize barren littoral habitats in many reservoirs (Miranda 200820). Woody materials flooded during impoundment disintegrate within a few decades (Agostinho et al. 199921). Inequalities in the manifestation of these and other key variables can reduce the correlation between chronological and functional age.

A limited number of published studies have included chronological age as a covariate in models designed to describe or predict reservoir biological characteristics, but chronological age has seldom been a reliable covariate. Jenkins and Morais (197122) examined various metrics descriptive of sportfishing effort and harvest and concluded that although, as expected, chronological age was inversely related to harvest, it accounted for less than 5% of the variability in harvest. Miranda and Durocher (198623) reported that growth of fish in reservoirs declined rapidly soon after impoundment, but subsequent reductions were minor, and Hendricks et al. (199524) reported that size of fish increased with reservoir age. In both of these studies, correlations with chronological age were unexpectedly low. Dolman (199025) reported that age did not help distinguish among distinct reservoir fish assemblages, and Carol et al. (200626) noted that chronological age surprisingly was not a primary factor governing nutrient levels or fish assemblages in reservoirs. These studies suggest that chronological age is not a good predictor of reservoir senescence (i.e., the process of growing old in a detrimental sense).

Miranda and Krogman (201527) evaluated functional age as an indicator of reservoir senescence. They used selected in-lake descriptors (Table 1.2) expected to change over the lifespan of a reservoir to construct a multimetric indicator of functional age. A scatterplot of functional age against chronological age showed no discernible pattern, and functional age scores were not correlated with chronological age. Reservoirs with the highest functional age scores generally occurred in the central USA from North Dakota to Texas and in agricultural regions of the Midwest. Thirteen reservoirs shared the lowest possible functional age scores; these reservoirs were mostly at high elevations in the Rocky Mountains and Appalachian Mountains.

Table 1.2. Variables included in the online survey (Krogman and Miranda 2016) and used to index functional age. Data were collected with a six-point ordinal scale with 0 = no degradation, 1= low, 2 = low to moderate, 3 = moderate, 4 = moderate to high, and 5 = high degradation.
Metrics Description
Mudflats Seasonally flooded and exposed expansive soft sediments; unvegetated unless exposed for many months
Low connectivity to tributaries because of sediment Sedimentation  has  decreased connectivity  to tributaries during low flows, acting as a barrier to fish movement
Insufficient structural habitat Lacking or deficient in structure such as large woody debris, gravel substrates, or diverse bottom relief
Excessive nutrients Excessive nutrients, primarily nitrogen or phosphorous, which may result in excessive primary productivity and reduced water quality
Harmful algal blooms Frequent occurrence of algal blooms that may be toxic to aquatic ecosystems or inhibit public enjoyment
Sedimentation Settling of suspended sediments, which over time may reduce depth and homogenize substrates
Shore erosion Removal of soil and terrestrial vegetation from the land–water interface, caused by weathering of banks or adjacent land slopes by water, ice, wind, or other factors
Loss of cove habitat resulting from depositional filling Sedimentation has changed cove habitat including area reduction, isolation, and fragmentation and establishment of terrestrial vegetation in newly deposited land
Shore homogenization Reduction of the shore's original habitat diversity by erosion or other processes
Homogenization of littoral substrates Reduction  of  the substrate's  original  diversity by  erosion and sedimentation
Figure 1.5. Functional age in relation to percent of cul- tivated land in the reservoir watershed (upper panel) and to mean depth of the reservoir (lower panel). Res- ervoirs in watersheds with high levels of cultivated land almost always have high functional age, whereas reservoirs with low levels of cultivated land can have low functional age, although the latter sometimes may have high functional age resulting from something other than cultivated land. Depth limits the maximum attainable functional age scores. In shallow reservoirs functional age scores can be much higher, although other reservoir attributes may prevent reaching high functional age.

Functional age was highly variable relative to reservoir depth and watershed agriculture (Figure 1.5). Nevertheless, functional age did show a decreasing trend relative to reservoir mean depth. This pattern suggests that depth limited the maximum functional age scores in deep lakes, and although higher scores could be attained in shallow lakes, often other mitigating circumstances prevented shallow lakes from reaching high functional age. Conversely, functional age showed an increasing trend relative to extent of cultivated land in the watershed (Figure 1.5). This pattern suggests that watersheds with high levels of cultivated land almost always tend to have a high functional age and watersheds with low levels of cultivated land tend to have lower functional ages, although the latter sometimes they may have high functional age resulting from something other than the effects of a cultivated watershed. Other reservoir attributes likely temper functional age, but additional research is needed.

According to Miranda and Krogman (2015) factors representing fishing quality, fish size, fish recruitment, and fish mortality were related to functional age in various fashions. Fishing quality decreased relative to functional age and mortality increased. Size and recruitment showed hump-shaped patterns relative to functional age (illustrated in Miranda and Krogman 2015), suggesting they were optimized at inter- mediate levels of functional age.

The concept of functional age has advantages. Combining multiple metric scores to assemble an indicator of senescence presents the possibility for management intervention from multiple angles. If it is determined that a reservoir is functionally aging at an accelerated rate, action may be taken to remedy the conditions contributing most to functional age. Intervention to reduce scores of selected metrics potentially can reduce the rate of senescence and increase the life expectancy of the reservoir. This leads to the intriguing implication that steps can be taken to reduce functional age and actually make the reservoir grow younger (Miranda and Krogman 2015). The goal of habitat rehabilitation often is to alter the trajectory of the aging process such that the duration of a desired state is prolonged (Pegg et al. 201528). Slowing down the rate at which functional age increases, or even reversing functional age after decades of substandard watershed management practices, is challenging. Most of the information presented in the following sections is intended to facilitate management of functional age.

Back to top

1.5 Downstream Concerns

A tailwater is the reach of a stream immediately below a dam that is hydrologically, physicochemically, and biologically altered by the presence or operation of the dam or both (Figure 1.6). A tailwater may be short or long, often persisting downstream to the confluence of a sizeable unregulated water source. The extent of stream alteration is related to the purpose of the reservoir, the design and depth of outlet structures (Walburg et al. 198129; Bednarek and Hart 200530), and the volume and schedule of water releases (Jager and Smith 200831). Although habitat management in the tailwater is beyond the scope of this document, sections 4 through 7 address issues that directly influence water releases into the tailwater.

Hydrologic alterations include changes to the natural timing and amount of discharge. Seasonal flows in tailwaters differ from natural flows and generally exhibit less temporal fluctuation (Johnson and Harp 200532). In regulated tailwater systems, flows outside a defined channel occur rarely and only during major floods. In some streams, particularly in the desert southwest, water may be present in a stream channel year-round below a dam, whereas the stream flowed ephemerally or intermittently before the dam was built (Sabo et al. 201233). Daily changes in flow resulting from peaking hydropower affect biota directly by stranding or indirectly by varying depth, temperature, and velocity (Gore et al. 198934; Nagrodski et al. 201235).

Figure 1.6. Tailrace area immediately below the Nolin Lake dam, Kentucky. Photo credit: U.S. Army Corps of Engineers, Louisville District.

Physicochemical changes include shifts in various water-quality characteristics (Cushman 198536; Ashby et al. 199837; Olden and Naiman 201038). Turbidity in streams and rivers below impoundments is reduced because the reservoir above the dam acts as a settling basin for fine sediment. Water temperatures in the tailwater, and subsequently the fish community,  may be changed relative to naturally occurring thermal regimes depending on the depth of water releases from the reservoir. Variables such as dissolved oxygen, pH, nutrients, and trace metal concentrations also may be affected by changes occurring within the reservoir and, in turn, may affect water quality in the tailwater reach.

Miranda and Krogman (201439) estimated the percentage of reservoirs with viable tailwaters in the USA. Viable tailwaters were those with sufficient flow to support a fish assemblage throughout the year. Overall, 42% of the sample reservoirs had viable tailwaters and, in general, the presence of a viable tailwater was related to the magnitude of the hydraulic system. Viable tailwaters commonly were associated with large, deep, high-storage-capacity reservoirs, whose basin had large catchments and substantial streamflows.

The survey also revealed that, in general, regions in the western USA tend to have longer tailwaters. Although the variability among tailwaters is high, and there are a large numbers of variables that interact to determine tailwater length, this effect is driven partly by reservoir characteristics. Tailwaters tend to be longer in large water- supply reservoirs with high storage capacity, which occur most commonly in the West. Length also was related directly to ratings assigned to degradations and differed among ecoregions. The principal stressors driving tailwater lengths were associated with flow (minimum flow, flow fluctuation, flow timing), fluctuating depth, bed scour, shore erosion, inadequate temperature, and overabundance of plants. Interestingly, variables related to gases and nutrients were not well associated with length of the affected reach. Thus, increasing the intensity of stress for flow-related variables can lead to affected reaches that are longer, but this effect may be weaker for chemical characteristics.

Major sources of environmental stress in viable tailwaters represent mostly issues associated with flow (Table 1.3). Flow is a major determinant of physical habitat in streams, which in turn is a major determinant of biotic composition (Bunn and Arthington 200240). Low base flows are pervasive below western reservoirs, especially in the Southwest. Flow changes and timing of flows, however, are important in most regions throughout the USA. Other issues, although occasionally important at the local level, afflict less than 20% of tailwaters. Base flow is one of the most widely studied aspects of regulated streams (Smakhtin 200141). During the dry season, minimum flows are often maintained in tailwaters to allow survival of biota, but the habitat they produce is usually of low quality and quantity (Walburg et al. 1981). During the wet season, storage reservoirs impound winter and spring runoff and as a consequence reduce tailwater flows. Below hydropower dams, large diel flow fluctuations can have destructive influences on the physical environment (Cushman 1985). The extreme variation in flow scours the tailwater, and high water velocities during power generation cause streambed instability, bank instability, and habitat degradation (Olden and Naiman 2010).

Table 1.3. Percent of viable tailwaters rated as moderate-to-high or high degradation with respect to 15 degradation variables by ecoregion and all ecoregions combined (Miranda and Krogman 2014). Percentages ≥ 20 are bolded. Values in parentheses are sample sizes. Ecoregion acronyms correspond to those in Figure 1.3.


Variables

WMT (60) XER (24) NPL (21) SPL (61) UMW (33) TPL (105) CPL (100) SAP (130) NAP (21) All (555)
Erosion 10 0 19 17 3 14 11 0 8 9
Scour 13 4 19 11 3 18 10 0 10 10
Fluctuating water levels 10 21 14 11 12 15 12 11 12 13
Low base flow 21 29 43 39 12 16 17 14 16 22
Fluctuating flows 25 29 38 34 15 32 25 14 22 25
Untimely flows 28 21 43 22 15 27 21 4 18 22
Temperature 5 8 0 8 0 4 3 21 7 6
Dissolved oxygen 3 4 0 13 0 6 7 0 7 4
Other dissolved gases 3 8 0 0 0 2 2 0 1 2
Water chemistry 3 13 0 6 6 8 7 4 4 6
Nutrients 7 4 0 3 3 9 2 0 3 3
Algal blooms 5 8 0 9 3 5 1 0 2 4
Overabundance of aquatic plants 5 13 0 8 0 8 5 0 6 5
Lack of structure 11 8 10 13 3 16 14 14 10 11
Nonnative species 5 0 29 8 18 37 10 0 7 12


In view of the importance of flows, additional emphasis is needed on management of minimum flows in tailwaters. A single minimum flow level throughout the year does not provide adequate protection for streams. Tailwater reaches require seasonally adjusted flow regimes to maintain their full ecological function (Poff et al. 199742; Richter et al. 199743). Few states have laws to provide “full protection” of flow regimes, and some states don’t have the legal framework that allows even “threshold, or minimum, flow protection” (Annear et al. 200944). Thus, in many cases more or better laws, regulations, and policies are needed to maintain adequate flows in tailwater reaches.

Back to top

  1. Krogman, R. M., and L. E. Miranda. 2016. Rating of U.S. reservoirs relative to fish habitat condition. Lake and Reservoir Management 32:51–60.
  2. Ploskey, G. R. 1986. Management of the physical and chemical environment: effects of water-level changes on reservoir ecosystems, with implications for fisheries management. Pages 86–97 in G. E. Hall and M. J. Van den Avyle, editors. Reservoir fisheries management: strategies for the 80s. American Fisheries Society, Bethesda, Maryland.
  3. Bunn, S. E., and A. H. Arthington. 2002. Basic principles and ecological consequences of altered flow regimes for aquatic biodiversity. Environmental Management 30:492–507.
  4. Dagel, J. D., and L. E. Miranda. 2012. Backwaters in upper reaches of reservoirs produce high densities of age-0 crappies. North American Journal of Fisheries Management 32:626–634.
  5. Kimmel, B. L., and A. W. Groeger. 1986. Limnological and ecological changes associated with reservoir aging. Pages 103–109 in G. E. Hall and M. J. Van den Avyle, editors. Reservoir fisheries management: strategies for the 80s. American Fisheries Society, Bethesda, Maryland.
  6. Kennedy, R. H., and W. W. Walker. 1990. Reservoir nutrient dynamics. Pages 109–131 in K. W. Thornton, B. L. Kimmel, and F. E. Payne, editors. Reservoir limnology: ecological perspectives. Wiley, New York.
  7. Thornton K. W. 1990. Sedimentary processes. Pages 43–70 in K. W. Thornton, B. L. Kimmel, and F. E., Payne, editors. Reservoir limnology: ecological perspectives. Wiley, New York.
  8. ISU (Iowa State University). 2013. Crop and land use: statewide data. Available online: www. Extension. Iastate. Edu/soils/crop-and-land-use-statewide-data
  9. IDNR (Illinois Department of Natural Resources). 2013. Land cover database by categories: cropland. Available online: http://dnr. State. Il. Us/orep/ctap/map/category. htm
  10. Smith, W. B., P. D. Miles, C. H. Perry, and S. A. Pugh. 2009. Forest resources of the United States, 2007. U.S. Department of Agriculture Forest Service, General Technical Report WO-78, Washington, D.C.
  11. USDA (U.S. Department of Agriculture). 2009. 2007 census of agriculture. Volume 1, part 51, United States summary and state data. Chapter 1, United States data. U.S. Department of Agriculture, National Agricultural Statistics Service, Washington, D.C.
  12. Ensign, S. H., and M. A. Mallin. 2001. Stream water quality changes following timber harvest in a coastal plain swamp forest. Water Resources 35:3381–3390.
  13. Troendle, C. A., and W. K. Olsen. 1994. Potential effects of timber harvest and water
    management on streamflow dynamics and sediment transport. Pages 34–41 in Sustainable Ecological Systems: Implementing an Ecological Approach to Land Management. General Technical Report RM-247. U.S. Department of Agriculture, Forest Service, Rocky Mountain Forest and Range Experiment Station Fort Collins, Colorado.
  14. Carney, E. 2009. Relative influences of lake age and watershed land use on trophic state and water quality of artificial lakes in Kansas. Lake and Reservoir Management 25:199–207.
  15. Baars, J., and H. Visser, editors. 2007. Aging and time: multidisciplinary perspectives.
    Baywood, Amityville, New York. 
  16. Kennedy, R. H. 1999. Reservoir design and operation: limnological implications and
    management opportunities. Pages 1–29 in J. G. Tundisi and M. Straškraba, editors. Theoretical reservoir ecology and its applications. Backhuys Publishers,
    Leiden, The Netherlands.
  17. Patton, T., and C. Lyday. 2008. Ecological succession and fragmentation in a reservoir: effects of sedimentation on habitats and fish communities. Pages 147–167 in M. S. Allen, S. Sammons, and M. J. Maceina, editors. Balancing fisheries management and water uses for impounded river systems. American Fisheries Society, Symposium 62, Bethesda, Maryland.
  18. Allen, H. H., and J. L. Tingle, editors. 1993. Proceedings, U.S. Army Corps of Engineers
    Workshop on Reservoir Shoreline Erosion Features; a National Problem. U.S. Army Corps of Engineers, Waterways Experiment Station, Miscellaneous Paper W, Vicksburg, Mississippi.
  19. Miranda, L. E., S. L. Wigen, and J. D. Dagel. 2014. Reservoir floodplains support distinct fish assemblages. River Research and Applications 30:338–346
  20. Miranda, L. E. 2008. Extending the scale of reservoir management. Pages 75–102 in M.
    S. Allen, S. Sammons, and M. J. Maceina, editors. Balancing fisheries management and water uses for impounded river systems. American Fisheries Society, Symposium 62, Bethesda, Maryland.
  21. Agostinho, A. A., and M. Zalewski. 1995. The dependence of fish community structure and dynamics on floodplain and riparian ecotone zone in Paraná River, Brazil. Hydrobiologia 303:141-148.
  22. Jenkins, R. M., and D. I. Morais. 1971. Reservoir sport fishery effort and harvest in relation to environmental variables. Pages 371–384 in G. E. Hall, editor. Reser- voir fisheries and limnology. American Fisheries Society, Special Publication 8, Bethesda, Maryland.
  23. Miranda, L. E., and P. P. Durocher. 1986. Effects of environmental factors on growth of largemouth bass in Texas reservoirs. Pages 115–121 in G. E. Hall and M. J. Van den Avyle, editors. Reservoir fisheries management: strategies for the 80s. American Fisheries Society, Bethesda, Maryland.
  24. Hendricks, A. S., M. J. Maceina, and W. C. Reeves. 1995. Abiotic and biotic factors re- lated to black bass fishing quality in Alabama. Lake and Reservoir Manage- ment 11:47–56.
  25. Dolman, W. B. 1990. Classification of Texas reservoirs in relation to limnology and fish community associations. Transactions of the American Fisheries Society 119:511–520.
  26. Carol, J., L. Benejam, C. Alcaraz, A. Vila-Gispert, L. Zamora, E. Navarro, J. Armengol, and E. Garcia-Berthou. 2006. The effects of limnological features on fish assem- blages of 14 Spanish reservoirs. Ecology Freshwater Fish 15:66–77.
  27. Miranda, L. E., and R. M. Krogman. 2015. Functional age as an indicator of reservoir senescence. Fisheries 40:170–176.
  28. Pegg, M. A., K. L. Pope, L. A. Powell, K. C. Turek, J. J. Spurgeon, N. T. Stewart, N. P. Hogberg, and M. T. Porath. 2015. Reservoir rehabilitations: seeking the foun- tain of youth. Fisheries 40:177–181.
  29. Walburg, C. H., J. F. Novotny, K. E. Jacobs, W. D. Swink, T. M. Campbell, J. Nestler, and G. E. Saul. 1981. Effects of reservoir releases on tailwater ecology: a litera- ture review. U.S. Army Corps of Engineers, Waterways Experimental Station, Technical Report E-81-12, Vicksburg, Mississippi.
  30. Bednarek, A. T., and D. D. Hart. 2005. Modifying dam operations to restore rivers: ecological responses to Tennessee River dam mitigation. Ecological Applications 15:997–1008.
  31. Jager, H. I., and B. T. Smith. 2008. Sustainable reservoir operation: can we generate hydropower and preserve ecosystem values? River Research and Applications 24:340–352.
  32. Johnson, R. L., and G. L. Harp. 2005. Spatio–temporal changes of benthic macroinver- tebrates in a cold Arkansas tailwater. Hydrobiologia 537:15–24.
  33. Sabo, J. L., K. Bestgen, W. Graf, T. Sinha, and E. Wohl. 2012. Dams in the Cadillac De- sert: downstream effects in a geomorphic context. Annals of the New York Academy of Sciences 1249:227–246.
  34. Gore, J. A., J. M. Nestler, and J. B. Layzer. 1989. Instream flow predictions and man- agement options for biota affected by peaking-power hydroelectric opera- tions. Regulated Rivers: Research and Management 3:35–48.
  35. Nagrodski, A., D. R. Graham, C. T. Hasler, M. K. Taylor, and S. J. Cooke. 2012. Fish stranding in freshwater systems: sources, consequences, and mitigation. Jour- nal of Environmental Management 103:133–141.
  36. Cushman, R. M. 1985. Review of ecological effects of rapidly varying flows down- stream from hydroelectric facilities. North American Journal of Fisheries Man- agement 5:330–339.
  37. Ashby, S. L., J. L. Myers, E. Laney, D. Honnell, and C. Owens. 1998. The effects of hydropower releases from Lake Texoma on downstream water quality. Jour- nal of Freshwater Ecology 14:103–112.
  38. Olden, J. D., and R. J. Naiman. 2010. Incorporating thermal regimes into environmental flows assessments: modifying dam operations to restore freshwater ecosystem integrity. Freshwater Biology 55:86–107.
  39. Miranda, L. E., and R. M. Krogman. 2014. Environmental stresses afflicting tailwater stream reaches across the United States. River Research and Applications 30:1184–1194.
  40. Bunn, S. E., and A. H. Arthington. 2002. Basic principles and ecological consequences of altered flow regimes for aquatic biodiversity. Environmental Management 30:492–507.
  41. Smakhtin, V. U. 2001. Low flow hydrology: a review. Journal of Hydrology 240:147– 186.

Become a Contributing Sponsor

Become a part of projects that need your support.