Chapter 4 : Eutrophication
- 4.1 Introduction
- 4.2 Trophic State Indices
- 4.3 Effects of Fish
- 4.4 Eutrophication Management
- 4.5 Downstream Concerns
4.1 Introduction
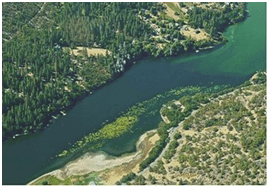
Eutrophication is the process of increasing nutrient enrichment, especially phosphorus and nitrogen, in which the enrichment leads to phytoplankton blooms and deterioration of water quality and causes changes to the ecosystem (NRC 2000). Eutrophication of a reservoir and the resulting increases in phytoplankton growth can have various direct effects on the quality of water within the impoundment. Eutrophication increases phytoplankton, zooplankton, bacteria, fungi, and detritus. Phytoplankton production in the reservoir shifts from green algae to cyanobacteria (Smith 1998), which is a less desirable condition because cyanobacteria can produce undesirable tastes and odors as well as produce toxins (Figure 4.1). Cyanobacteria can out-compete green algae under low nitrogen to phosphorus ratios because of their ability to fix atmospheric nitrogen, they have nitrogen-storing heterocysts that help maintain buoyancy and thereby shade out other genera, and their ability to proliferate in hot and stagnant water, as well as other advantages (Scheffer et al. 1997). However, cyanobacteria may be less available as food for certain organisms (e.g., cladocerans) because of their larger size; also they may not provide sufficient nutrition (Smith 1998). As cyanobacteria blooms subside, the dead and decaying cells can reduce oxygen levels in the water, causing stress or death to aquatic animals and potentially prolonging stratification. Dissolved oxygen concentrations in eutrophic waters become more variable, reaching higher highs and lower lows (Bouvy et al. 1999).
Although phosphorus and nitrogen occur in many different chemical forms in aquatic environments, it is the dissolved inorganic forms that are most readily available for assimilation by phytoplank- ton. Analyses of the inorganic species, ammonium (NH4) and nitrogen oxides (NOx), give reliable estimates of bioavailable nitrogen. Bioavailable phosphorus is more difficult to measure because of its high affinity to particles and because it is frequently used as soon as it enters the water column by algae and plants. Bioavailability of phosphorus varies depending on the source. Gerdes and Kunst (1998) showed that 72% of the total phosphorus in effluent from sewage treatment plants was bioavailable, but only 30% of the total phosphorus in eroded material entering a river was available. They also showed that this percentage increased to 59% when the soils from which the material was sourced were fertilized, suggesting that fertilizer introduced significant amounts of bioavailable material into the runoff.
Well-defined relationships between phosphorus and phytoplankton biomass (i.e., chlorophyll-a) have been identified in reservoirs (e.g., Hoyer and Jones 1983; Jones and Knowlton 1993). Consequently, phosphorus often has been considered the primary nutrient limiting phytoplankton production in reservoirs, and management ef- forts to control eutrophication generally have emphasized control of phosphorus loadings (e.g., Dodd et al. 1988). However, Elser et al. (1990) reviewed various studies and reported that co-limitation by nitrogen and phosphorus was a common response of phytoplankton to nutrient additions. In Kansas reservoirs, Dzialowski et al. (2005) reported that the addition of phosphorus or nitrogen alone rarely increased phytoplankton growth. Instead, growth was co-limited by both nutrients. Generally, reservoirs that were nitrogen limited had total nitrogen to total phosphorus ratios (TN:TP) <18; reservoirs that were co-limited by nitrogen and phosphorus had TN:TP between 20 and 46; and reservoirs that were phosphorus limited had TN:TP >65. Overall, these results suggested that in Kansas reservoirs management efforts might need to focus on both nutrients (Dzialowski et al. 2005).
In reservoirs, eutrophication is accelerated by a large watershed-to-lake-area ratio (Wetzel 1990). Croplands in the watersheds of reservoirs are usually the biggest contributors to eutrophication. The proportion of cropland cover in the watersheds of 126 Missouri reservoirs accounted for 60%–70% of the variance in long-term averages of total phosphorus and total nitrogen (Jones et al. 2004). Even among reservoir watersheds with >80% grass (including pasture) and forest cover, cropland accounted for most of the variation in nutrients. Reservoir nutrients showed a strong negative relation to forest cover. Relations between grass cover and nutrients were positive but weak, and grass had no detectable effect once the effects of croplands was taken into account. In this set of Missouri reservoirs, urban reservoirs had about twice the nutrient levels as reservoirs in forest and grass watersheds.
4.2 Trophic State Indices
Indices of trophic state based on readily obtainable water-quality data are used to describe the trophic state of lakes but have been modified for use in reservoirs. Indices assign trophic states according to the phytoplankton biomass present during summer (indexed by chlorophyll-a biomass), the concentrations of key nutrients(phosphorus and nitrogen), and water transparency as measured with a Secchi disk (Table 4.1). This trophic classification of reservoirs results from the division of a trophic continuum into categories called trophic states. The trophic state of reservoirs is indicative of their biological productivity, that is, the amount of living material supported within them, primarily in the form of phytoplankton. The least productive reservoirs are classified as oligotrophic. These are typically deep and clear and have relatively low nutrient concentrations. The most productive reservoirs are classified as hypereutrophic and are characterized by high nutrient concentrations and shallow depth, which result in phytoplankton growth, cloudy water, and low dissolved oxygen levels.
Table 4.1. Trophic state classification based on total phosphorus, total nitrogen, chlorophyll-a, and Secchi depth visibility for lakes (Forsberg and Ryding 1980) and for reservoirs (Jones and Knowlton 1993) in parentheses.| Trophic state | Total phosphorus (ppb) | Total nitrogen (ppb) | Chlorophyll-a (ppb) | Secchi depth (ft) |
| Oligotrophic | <15 (≤10) | <400 (<350) | <3 (<3) | >13 (≥8.5) |
| Mesotrophic | 15–25 (>10–25) | 400–600 (≥350–550) | 3 –7 (≥3–9) | 8–13 (≥4–8.5) |
| Eutrophic | >25–100 (>25–100) | >600–1500 (≥550–1200) | ≥9–40 (≥9–40) | 3–8 (≥1.5–4) |
| Hypereutrophic | >100 (>100) | >1500 (>1200) | >40 (>40) | <3 (<1.5) |
4.3 Effects on Fish
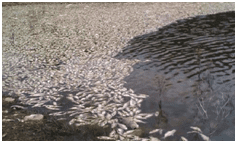
Early stages of eutrophication may enhance fish growth and biomass and seem to be desirable from a fisheries perspective (i.e., more nutrients = more fish). However, water-quality changes associated with higher trophic states (e.g., hypoxia, denser phytoplankton blooms, reduced water clarity, and altered fish fauna) usually argue against promoting higher trophic states because of changes in fish food habits, spatial distribution, and community composition. In fact, extreme cases of hypereutrophication promote dense, noxious phytoplankton blooms that can cause fish kills (Figure 4.2). Moreover, phytoplankton communities in eutrophic reservoirs can shift from domination by green algae to potentially noxious cyanobacteria. While this dominance may shift seasonally in many reservoirs, cyanobacteria tend to dominate for an increasingly longer segment of the year in eutrophic and hypereutrophic reservoirs (Smith 1998) and are considered “sentinels” of eutrophication (Stockner et al. 2000). In turn, zooplankton composition is affected by phytoplankton availability because macrofiltrators (usually large-bodied zooplankton) that are more abundant in oligotrophic reservoirs give way to low-efficiency, small-bodied phytoplankton and bacterial feeders as nutrients increase (Taylor and Carter 1997). In hypereutrophic reservoirs, the food supply for zooplankton actually may decrease because of the dominance by cyanobacteria.
Eutrophication can lead to undesirable shifts in fish community composition. Although early stages of eutrophication may enhance fish growth and fishery yield, later stages may force changes in food habits, spatial distribution, and community composition (Larkin and Northcote 1969). In Florida lakes, fish biomass increased with eutrophication status to a maximum in mesotrophic lakes and fluctuated around the maximum value in hypereutrophic lakes (Kautz 1982). In contrast, fish density increased to a maximum in mesotrophic lakes but declined in hypereutrophic lakes. Piscivorous fishes reached maximum biomass and optimum densities in lakes with a total nitrogen concentration of 1,200 ppb and a chlorophyll-a concentration of 11 ppb but suffered adverse effects with further enrichment (Bachmann et al. 1996). Nevertheless, planktivorous (Yurk and Ney 1989; Bachmann et al. 1996) and benthivorous fish have been observed to increase with eutrophication status (Persson et al. 1991; Jeppesen et al. 2000).
Trophic state reportedly has a major influence on gizzard shad population characteristics in reservoirs (Power et al. 2004; Gonzalez et al. 2010). Gizzard shad represent an important prey species for many piscivorous fish. In oligomesotrophic reservoirs in Alabama, gizzard shad abundances were relatively low, yet these populations contained faster-growing fish (after age 1) and a higher proportion of older fish (DiCenzo et al. 1996). Furthermore, populations in less productive reservoirs contained fewer gizzard shad but a higher percentage of larger gizzard shad. In eutrophic reservoirs, gizzard shad were more abundant, and the population was characterized by smaller, slower-growing fish that were more vulnerable to predation. Consequently, gizzard shad were more available as forage in eutrophic reservoirs because of their greater abundance, smaller size, and slower growth, which made them vulnerable to predation for a longer period of time.
Concerted efforts by government agencies and private citizens to reverse cultural eutrophication (e.g., promoting or mandating the use of phosphorus-free laundry detergents, building more efficient wastewater treatment plants, agriculture best management practices) have ocassionally led to unwanted consequences. Specifically, nutrient loading rates into some reservoirs were reduced at a time when many reservoirs were experiencing decreased internal nutrient-loading rates and trophic depression in the decades following impoundment. Rates of nutrient loading and trophic states have changed so abruptly in a few systems that a new word entered the lexicon of reservoir and lake managers: oligotrophication. Moving from eutrophy to mesotrophy or from mesotrophy to oligotrophy usually results in clearer water because of reduced phytoplankton biomass, which most citizens equate to “cleaner” water. However, the trade-off between “clean water” and productive fisheries began to be discussed by fisheries biologists (e.g., Ney 1996; Stockner et al. 2000). The tight linkage between phytoplankton standing crops or phosphorus concentrations and fish biomass and sport fish harvest means that fisheries can suffer in reservoirs that shift to a lower trophic state.
The trade-offs between cleaner water and popular recreational fisheries were investigated by Maceina et al. (1996). They showed that modest shifts in trophic state could achieve clearer water while still maintaining good fisheries. A reduction in chlorophyll-a concentrations in eutrophic reservoirs in Alabama to 10–15 ppb was projected to increase water clarity and improve aesthetics for other recreational users without adverse effects to recreational fisheries. If a shift in trophic state was to occur from eutrophic to oligomesotrophic, catch rates of major recreational species was unlikely to shift, but in some instances smaller fish could result.
4.4 Eutrophication Management
Become a Contributing Sponsor
Become a part of projects that need your support.